Polyhedra Viewer - Data Structures
To encode operations on polyhedra, you need a data structure the describes what a polyhedron is, and a way to tell which operations transform one polyhedron into another. In this section, I’ll be discussing the two main data structures that make the Polyhedra Viewer possible: the graph of polyhedral operations and the object used to model an actual polyhedron. I’ll go over my process of iterating on these structures and the things I learned and wish to improve on.
Operation Graph
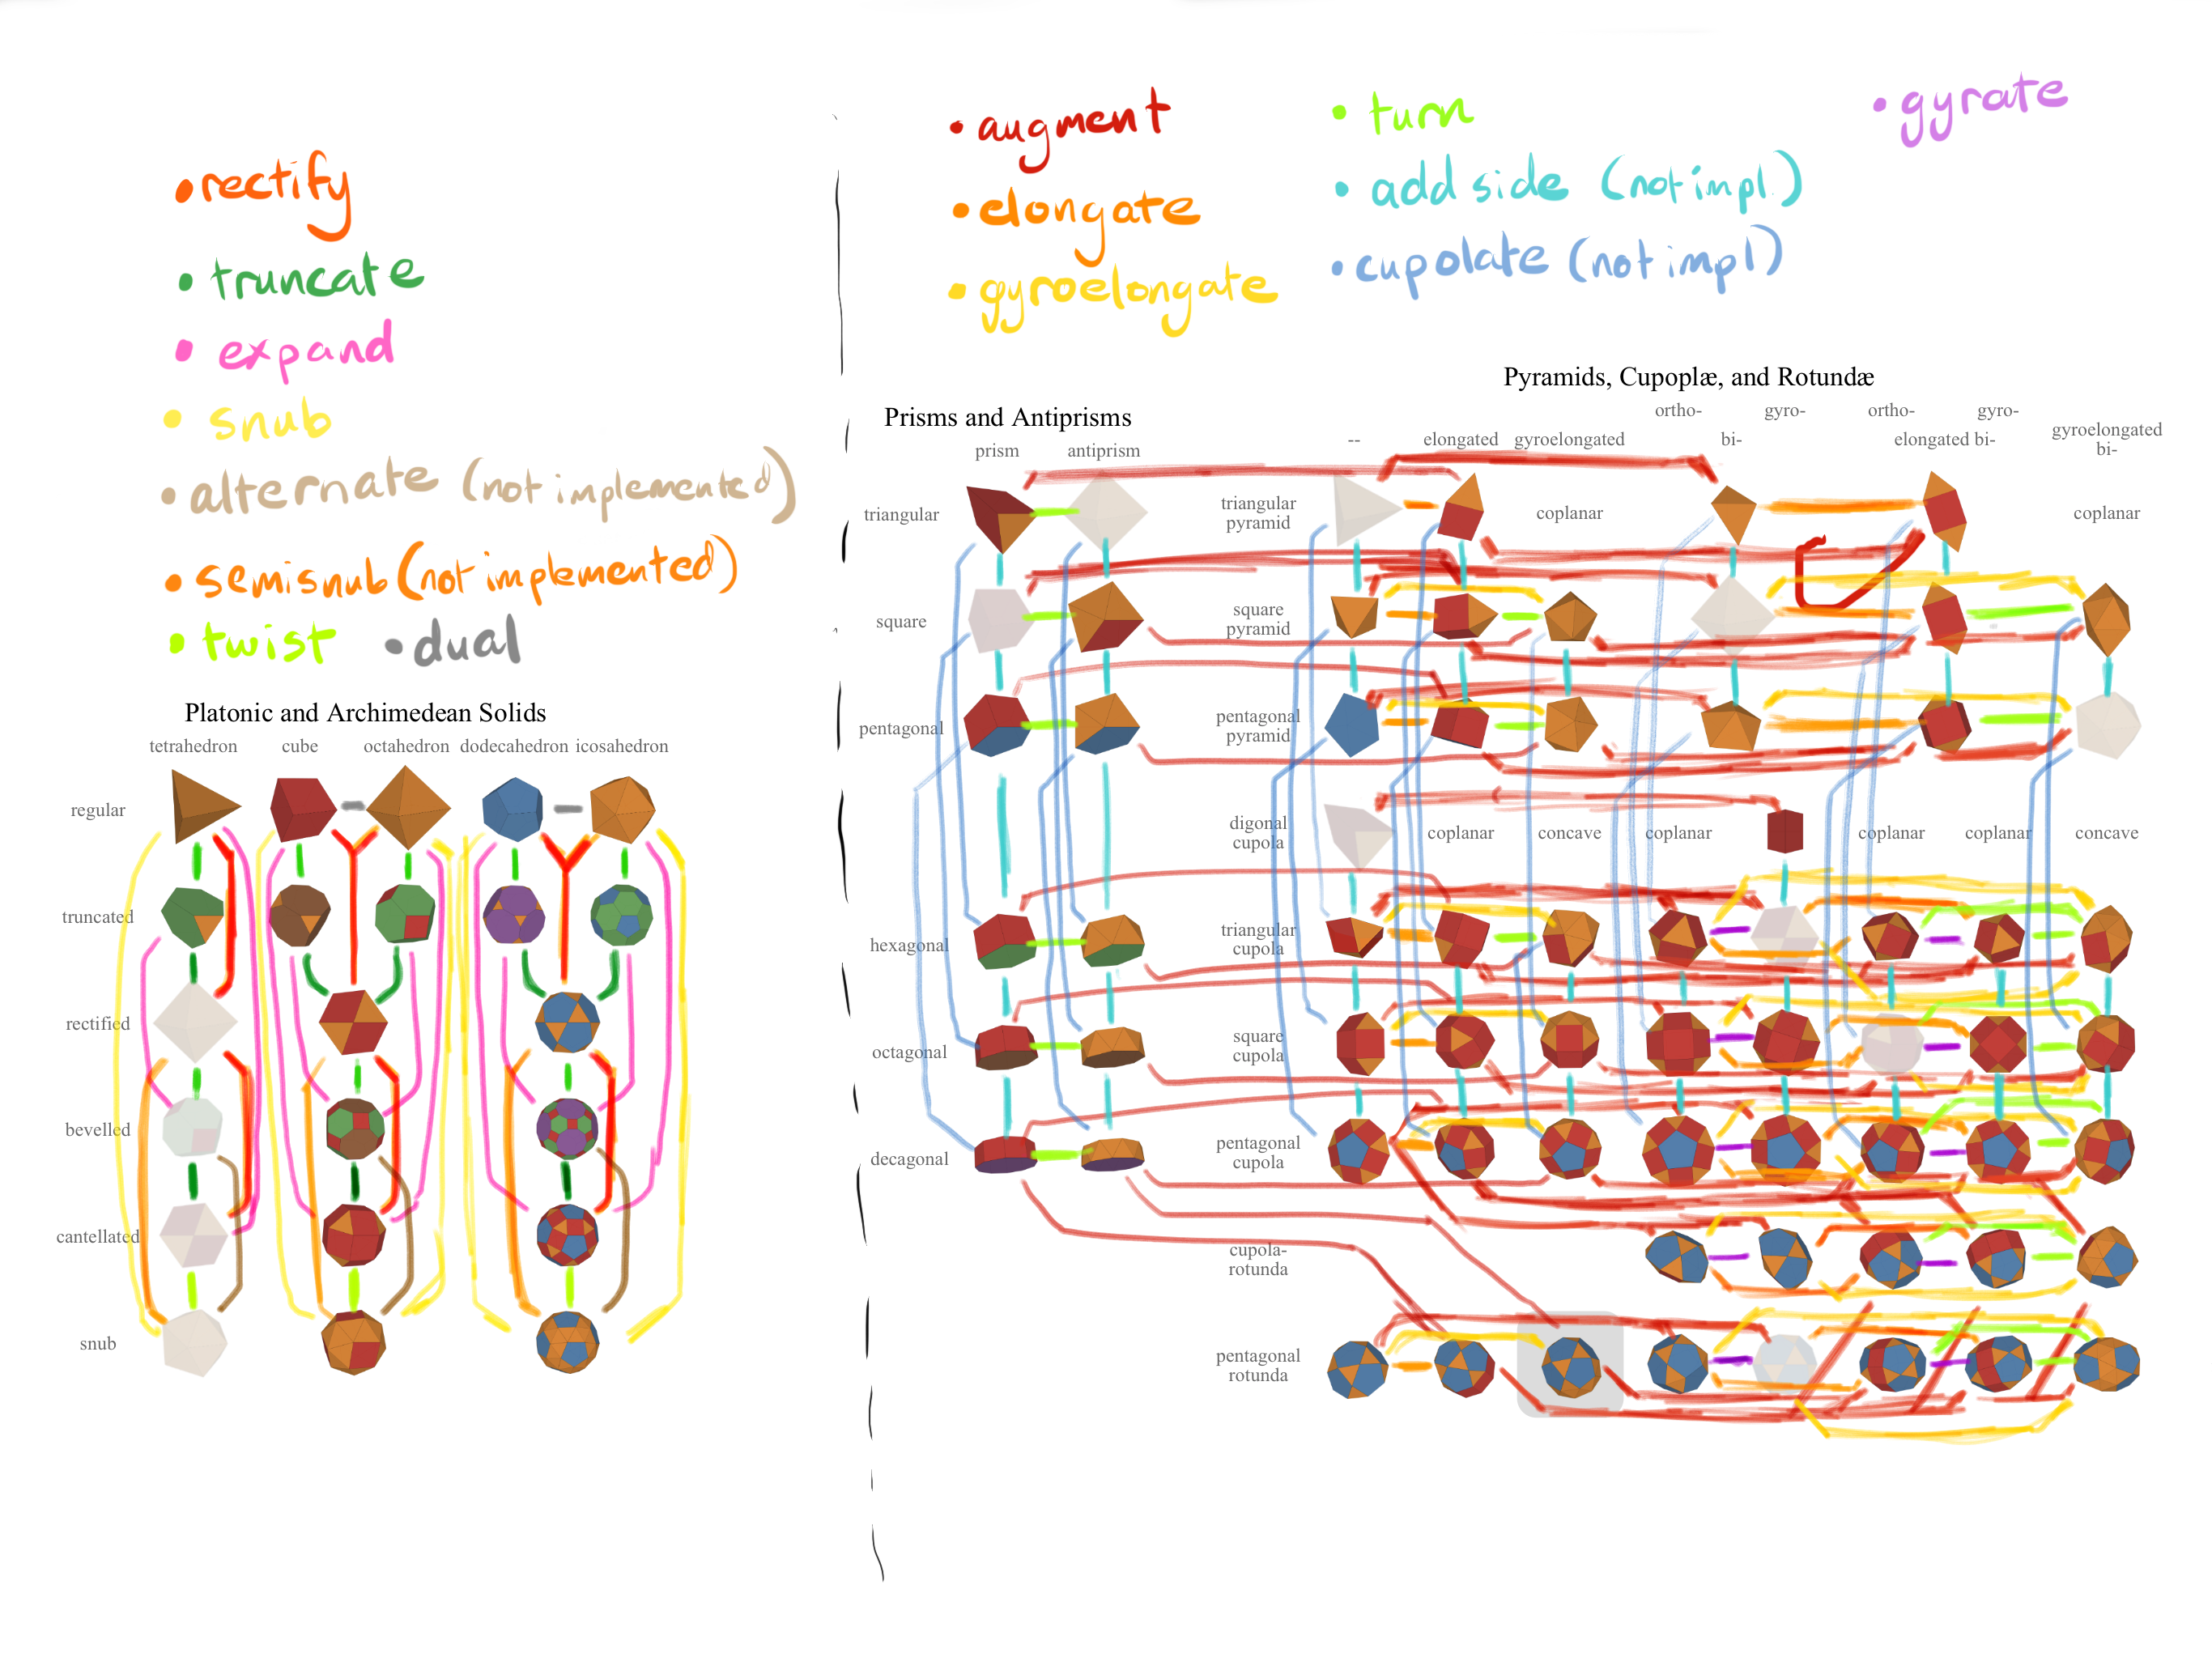
The first step was to encode the operations that mapped the polyhedra to each other. In math terms, this means creating a directed graph with different polyhedra as nodes and operations as edges. The edges needed to be labelled when an operation can have more than one result. For example, when augmenting an augmented hexagonal prism with another pyramid, the edges have to be labelled with “meta” or “para” depending on whether the additional pyramid is across or aside from the currently existing one.
For some of the graph, I hand coded these relations: I put each table in Photoshop and drew the relations between them, then converted them to a JSON format:
{
  J63: {
    '+': [
      { faceType: 3, value: 'J64' },
      { faceType: 5, value: 'J62' }
    ]
  },
  J62: {
    '+': [{ align: 'meta', value: 'J11' }]
  },
  A5: {
    '+': [{ align: 'para', value: 'J11' }]
  }
}
The value is the result of the operation, and align and faceType are labels that disambiguate between two options. Note that, I only encode the augment operations. Since diminish is the inverse operation, I can dynamically add it later using a helper function.
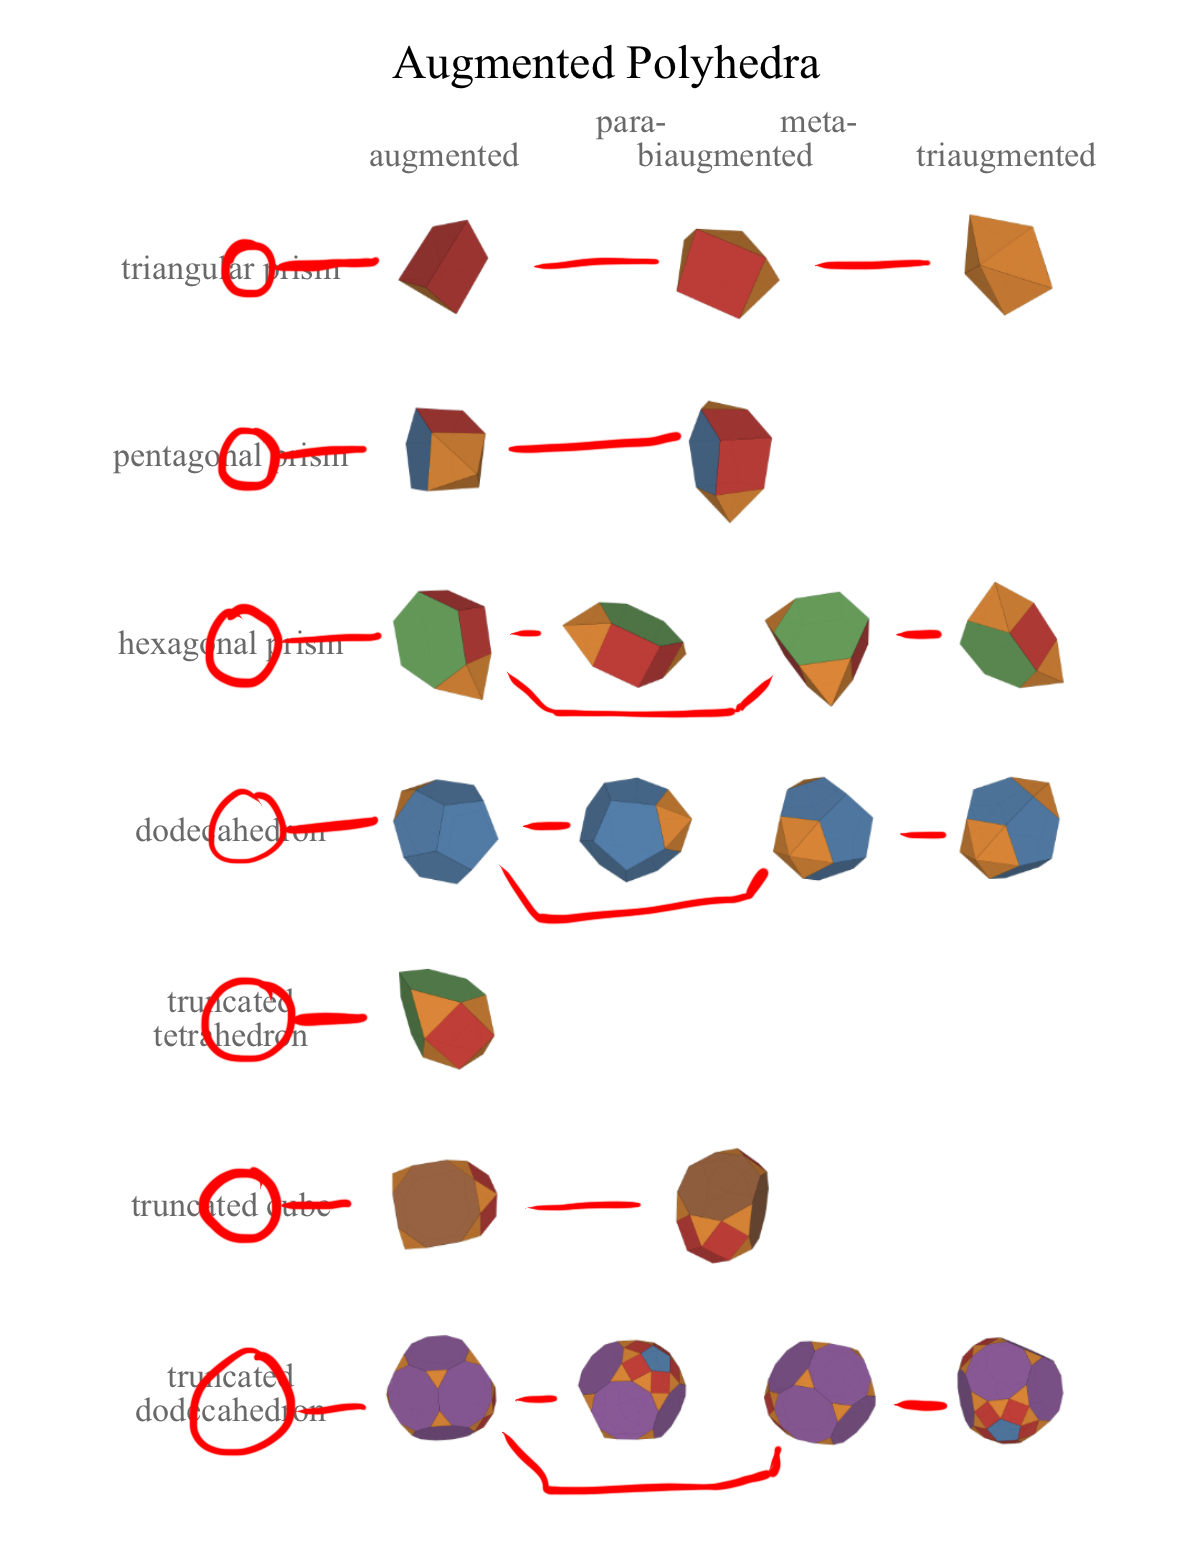
While this worked for small sections, hand-coding the majority of the graph would have been too tedious. I needed a way to automate what I already had to make it easier. I already had this data encoded in the table that showed what polyhedra thumbnails and labels to show in each table. For example, this is the data associated with augmented polyhedra:
export const augmented: Table = {
  caption: 'Augmented Polyhedra',
  rows: [
    'triangular prism',
    'pentagonal prism',
    'hexagonal prism',
    'dodecahedron',
    'truncated tetrahedron',
    'truncated cube',
    'truncated dodecahedron',
  ],
  columns: [
    'augmented',
    { name: 'biaugmented', sub: ['para-', 'meta-'] },
    'triaugmented',
  ],
  data: [
    ['J49', 'J50', 'J51'],
    ['J52', 'J53'],
    ['J54', ['J55', 'J56'], 'J57'],
    ['J58', ['J59', 'J60'], 'J61'],
    ['J65'],
    ['J66', 'J67'],
    ['J68', ['J69', 'J70'], 'J71'],
  ],
};
This data is processed to generate the table of augmented polyhedra, which we can then annotate with the correct operations:
I created a function to take each of these tables and convert them into the same graph format as before, and created a merge function that combined all these graphs:
const getBiAugmented = (biaugmented, faceType) => {
  if (!_.isArray(biaugmented)) {
    return [{ faceType, value: biaugmented }];
  }
  return [
    { faceType, value: biaugmented[0], align: 'para' },
    { faceType, value: biaugmented[1], align: 'meta' },
  ];
};

const augmentations = (() => {
  let graph = {};
  // Convert the table to be key-value pairs instead of an array, e.g.:
  // { 'pentagonal prism': { augmented: 'J52', biagumented: 'J53' } }
  const augmentationMap = convertTableToMapping(augmented);

  // Iterate through the rows of the table
  _.forEach(augmentationMap, (row, name) => {
    const base = toConwayNotation(name);
    const { augmented, biaugmented, triaugmented } = row;
    const faceType = getAugmentFaceType(name);
    graph = graphMerge(graph, {
      [base]: {
        '+': { faceType, value: augmented },
      },
      [augmented]: {
        // Disambiguate when there are two possibilities
        '+': getBiAugmented(biaugmented, faceType),
      },
      [_.isArray(biaugmented) ? biaugmented[1] : biaugmented]: {
        '+': { faceType, value: triaugmented },
      },
    });
  });
  return graph;
})();
In essense, (1) we convert the initial table to a mapping of row names to row data, (2) we iterate over the rows and add the relationships of each row into the graph.
The end result is probably the most convoluted part in the codebase, a 500-line monstrosity filled with edge cases and hacks. I wanted to write this quickly so I could focus on the actual operations, so I used Conway notation for the polyhedra and single-letter symbols for each operation (e.g., ‘+’ for augment and ‘s’ for snub). I also wrote a bunch of normalization functions so I could be fluid with the data that I write (e.g. convert a single value to an array of values). While this initially made it easy to make the graph, it ended up being a pain point later, since it was difficult to read and thus update the graph!
I was able to mitigate the graph’s complexity by encapsulating it in utility functions and adding plenty of unit tests to check for easy mistakes. I’ve thought about redoing parts of it, for example creating it from more robust data rather than deriving it from a table layout, or using operation names instead of symbols. But it’s fine for now and it hasn’t been worth taking the effort to refactor it yet.
Getting the operation result
If you do an operation on a polyhedron, you’ll notice that the name on the screen and the URL updates to the new name! This was essential: the point of the app is to show how polyhedra in a particular set were related, not only to support arbitrary operations.
The algorithm to choose the next name of the polyhedron is as follows:
- Reference the operation graph to determine the possible results of the operation on the polyhedron.
- Use a helper function defined for each operation to determine additional labels to filter by.
- Filter the results using the defined labels and get the singular result.
To use our example of augmenting an augmented hexagonal prism, the user might pick a face across or beside the currently augmented face. Referencing the graph returns two possibilities:
[
  { value: 'J55', align: 'para' },
  { value: 'J56', align: 'meta' }
]
A helper function defined for the augment operation would be passed in the current polyhedron and face the user chose to augment. It would compare the direction of the face to the direction of the current augmented pyramid and return { align: 'para' } if the face was opposite or { align: 'meta' } if not. This search filter can be used to pick the correct result from the possibilities.
Polyhedron Data Structure
Coding a bunch of polyhedron operations means turning mathematical ideas said in natural language like “pull out this polyhedron’s faces X amount”, “Find the face opposite of this one”, or “find all the vertices connected to this one” into instructions a computer could understand. I needed a format to understand this data that was efficient and easy to understand so I could code up operations quickly. This ended up taking a few iterations, each with their own improvements and trade-offs.
Raw polyhedron data
To start off, I just used the raw polyhedron data I had been using in the view code: a list of vertex coordinates, a list of vertex indices representing faces, and a list of edges (which can be derived from the list of faces). For example, for a tetrahedron:
{
  "vertices": [
    [0.0,0.0,1.732051],
    [1.632993,0.0,-0.5773503],
    [-0.8164966,1.414214,-0.5773503],
    [-0.8164966,-1.414214,-0.5773503]
  ],
  "edges": [[0,1],[0,2],[0,3],[1,2],[1,3],[2,3]],
  "faces": [[0,1,2],[0,2,3],[0,3,1],[1,3,2]]
}
This worked fine for about a minute. I soon found myself recalculating a lot of data for a single polyhedron. For example, it was often useful to have a graph mapping the vertices of a polyhedron to their adjacent faces. If I wanted to use this graph over multiple functions, I would have to pass it down as an argument or recreate it every time. I knew I needed to wrap that information in a class.
Polyhedron wrapper class
The initial Polyhedron class was motivated more by convenience than “performance”. For example, we might want to create a function that determines the faces adjacent to each vertex. To do this efficiently, we could create a graph mapping vertices to their adjacent faces. Without a class, we would have to either recalculate that graph every time, or pass it in as an argument to any function that requires it, which is cumbersome. Instead, make the function a method of the polyhedron class, and make the graph memoized so that it only does the calculation the first time.
class Polyhedron {
  ...

  vertexToFaceGraph: _.once(() => {
    // lazily calculate the vertex-to-face mapping
    ...
  })

  adjacentFaces(vertexIndex: number) {
    return this.vertexToFaceGraph()[vertexIndex]
  }

  ...
}
Aside from generic algorithm best practices (i.e., if you can do an O(n) algorithm instead of an O(n^2) algorithm, do it) I didn’t worry too much about optimization. The Polyhedron class was immutable: it would only represent a single set of coordinates, edges, and faces, and any transformations would have to return a new polyhedron object. From my experience, performance tends to become an issue when operating on lists of thousands of entries. While the polyhedra operations were complex, the highest number of vertices you ever had was around 100, which was hardly enough to be worried about. When viewing the actual animations in the browser, the time it took to calculate each operation was imperceptible.
Vertex, Edge, Face objects
While the shared methods helped clean up some of the confusion, there was still a lot that was cumbersome. Edges and faces were represented as arrays of vertex indices. This meant that any time you wanted to store a list of vertices or faces, you’re actually storing an index, or in other words, an integer. At the most convoluted point, I had a vertex-to-vertex graph, a vertex-to-face graph, a face-to-face graph, and more! Even with type checking, it was impossible to know whether a number represented a vertex index, a face index, an index of a temporary array used in the operation, or a mathematical constant.
For a while, I entertained the idea of making wrapper objects for vertices, edges, and faces (collectively “facets”) that contained stored data like “what faces are next to me?” But by this point I had already implemented a fair number of operations and the refactor would be pretty significant.
I try to be cautious about undertaking large refactor attempts. I’m one of those strange people who actually likes refactoring. This is usually a good thing, but often times in previous jobs I would end taking on large amounts of refactoring work that didn’t actually need to be done, in lieu of doing work that gets a product shipped. I always try to reason through how exactly refactoring something can help me in the long run and what are the pain points that require it.
One day, while I was visiting family in Houston, I finally got my chance. I decided since I was on “vacation” I didn’t need to do “real” work like implementing more operations, so I decided to try out the refactor “for fun”.
I started by adding a Face class, since it was the most complicated object, and when that saw that it simplified things I moved on to the Vertex and Edge classes. I was able to use find and replace on my IDE in most places. I had a good test suite, so I was pretty confident that my changes didn’t break much.
In the end, it was a really good idea! I was able to tear out a lot of the code in the Polyhedra class and move it to much simpler functions in the respective facet classes. For example, instead of an adjacentFaces() method in the Polyhedron class that took an index, I could define it on the vertex object.
class Vertex {
  ...

  adjacentFaces() {
    // calculate adjacent faces
  }

  ...
}
So I could make the following changes:
// before
_.forEach(_.range(polyhedron.vertices.length), vIndex => {
  const adjacentFaces = polyhedron.adjacentFaces(vIndex);
  // do something with faces
});

// after
_.forEach(polyhedron.vertices, v => {
  const adjacentFaces = v.adjacentFaces();
  // do something with faces
});
Using these classes also allowed me to implement a doubly connected edge list (DCEL) structure. In essence, it puts the vertices, edges, and faces in a graph and allows you to efficiently calculate the adjacent facets of any facet. You can find the adjacent faces of an edge or a vertex, or adjacent edges of a face. Plus, they will be returned in counter-clockwise order! Using this structure allowed me to simplify many of the algorithms I had already made.

There were a few downsides to the wrapper classes though. I needed custom methods whenever equality is concerned, since the wrappers didn’t have the native equality that raw numbers did. I still had to use indices when I had to make a new mapping for an algorithm. The classes relied on circular references to the polyhedron that contained them, which was hard to annotate with types. Also, because the wrappers were linked to the polyhedron they came from, this led to annoying errors whenever I dealt with two different intermediate polyhedra.
Overall, it was a good idea to introduce these wrappers, but I’m not sure when would have been the ideal time to introduce them. If I introduced them in the beginning, would I have been able to make the algorithms much quicker or would I just have been confused? If I hadn’t taken a “vacation”, would I eventually have realized their need or would I have tried to go on with the previous data structure? Is there some other refactor that I should have done by now that would have made my current algorithms trivial? I included the anecdote of visiting my parents to show that it’s not easy to tell how useful a certain refactor will be ahead of time, and to underscore how important it is to use practices that make it easy to refactor: plenty of tests covering your use cases and clearly encapsulating your code.
Capstones
Besides to Polyhedron and classes for different facets, there was one more abstraction I that I found useful. For some operations, such as diminishing, gyrating and elongating, it was important to be able to distinguish the properties of a component of a polyhedron that is a pyramid, cupola, or rotunda. I called these components “capstones” since they resemble the capstone of an architectural structure and “cap off” their polyhedra. It was useful to know which vertices compose the capstone and the vertices comprise its boundary. As with other classes, encapsulating this concept in a class made it easy for me to express things like “check that this polyhedron has two opposite rotundae”. The diminish and gyrate operations actually take capstone objects as arguments!
Conclusion
I’m pretty satisfied with the data structures I created and they’ve served me well in expressing complex concepts. There will always be “improvements” that one can make to one’s code, and I’ve tried to be careful and only make those that can lead to a significant improvement in productivity. That’s why I created the Vertex object while leaving the operations graph as is.
In the next section, I’ll go over the code behind the main feature of the app: the algorithms transitioning one polyhedron to another.
Part of a series of blog posts about the creation of the Polyhedra Viewer.